
Overview
Analytics is your operational dashboard. Open Analytics from the main menu to see how fast your team responds, how the AI is performing, how cleanings are rated, how your staff use Ask AI, and how reviews are trending. The surface is organized into five tabs.
Most views support a date range filter so you can compare periods. The AI Messaging escalation and Autopilot lists also support filtering by category and by listing.
Response Times
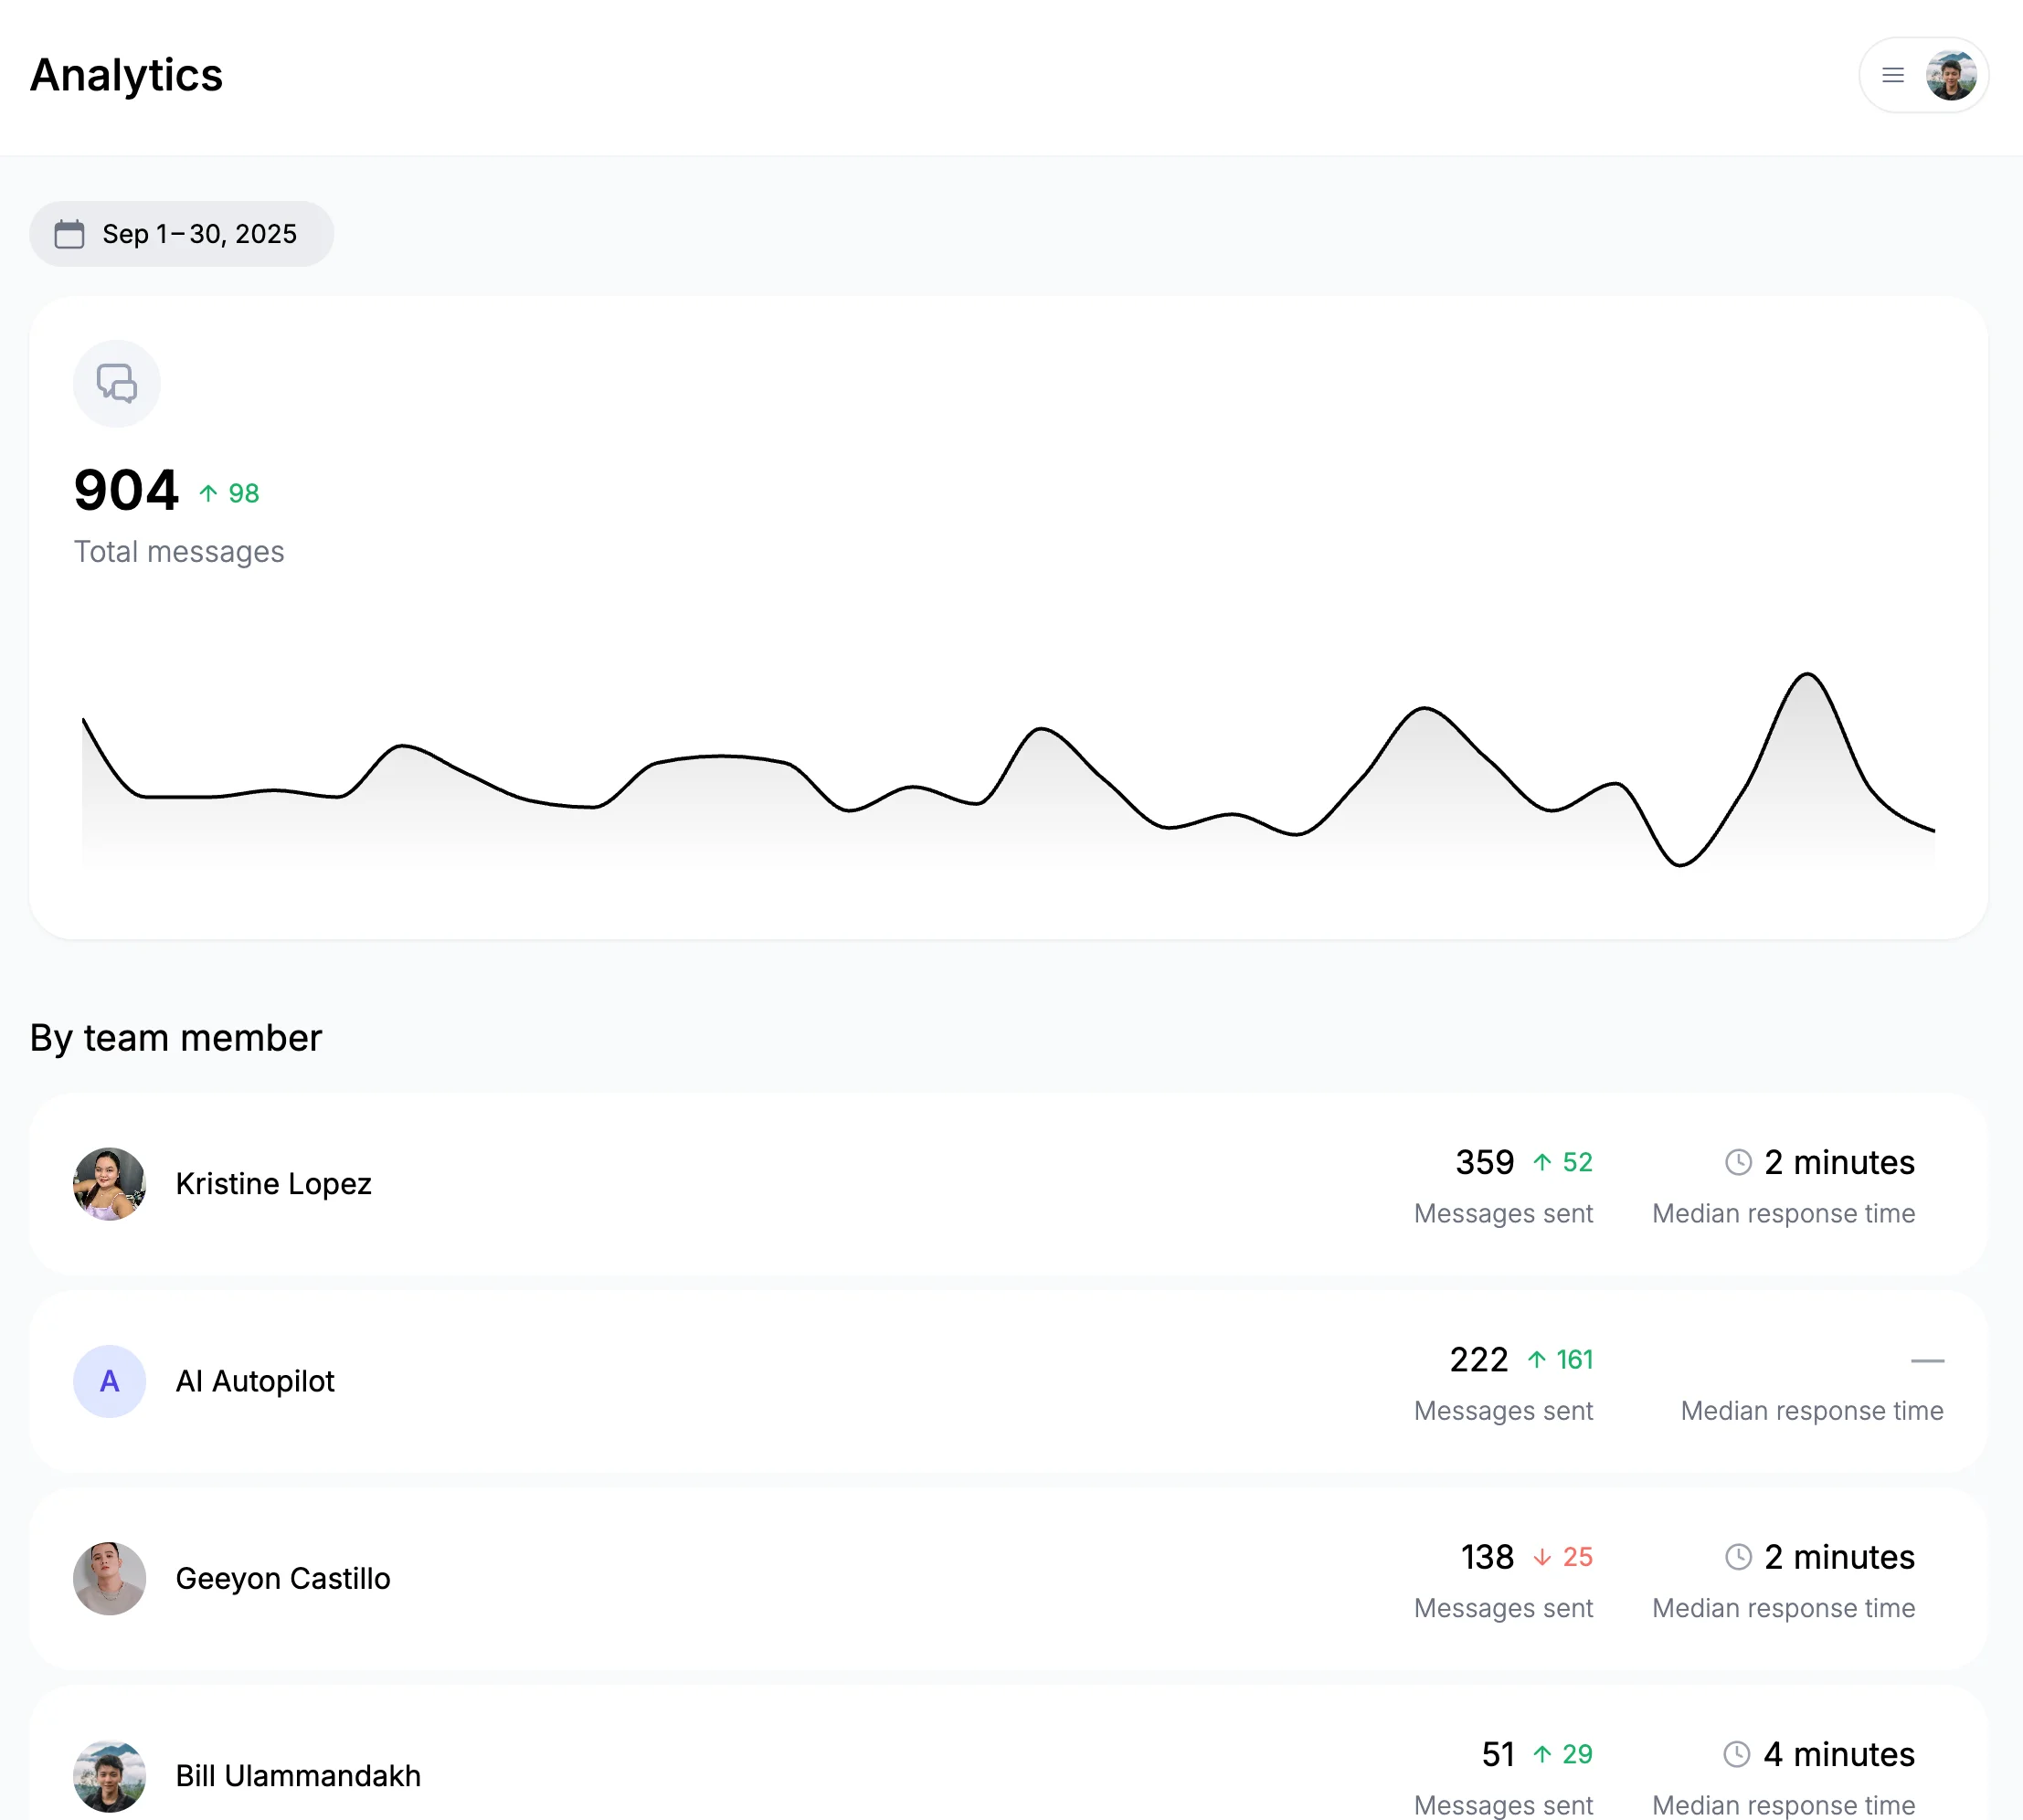
The default tab covers messaging operations:
- Response times — median plus p25, p75, and p95, so you see typical and worst-case speed.
- Total messages sent — overall volume with daily trends and the change versus the prior period.
- Messages by team member — per-person volume, trend, and response times. Messages handled by Autopilot show under "Autopilot."
AI Messaging
A deeper look at how the AI is doing on guest conversations:
- Overview — total suggestions, average confidence, average guest sentiment, high-urgency count, and negative-sentiment count.
- Category breakdown — how guest messages split across categories, with a per-category performance table (count, average confidence, urgency, and sentiment).
- Confidence distribution — suggestions bucketed by confidence (95–100%, 90–95%, 80–90%, below 80%), so you can see what's Autopilot-ready versus what gets escalated.
- Urgency × sentiment matrix — each suggestion plotted by urgency against sentiment to surface tense or time-sensitive threads.
- Trends over time — daily suggestion volume, average confidence, and average sentiment.
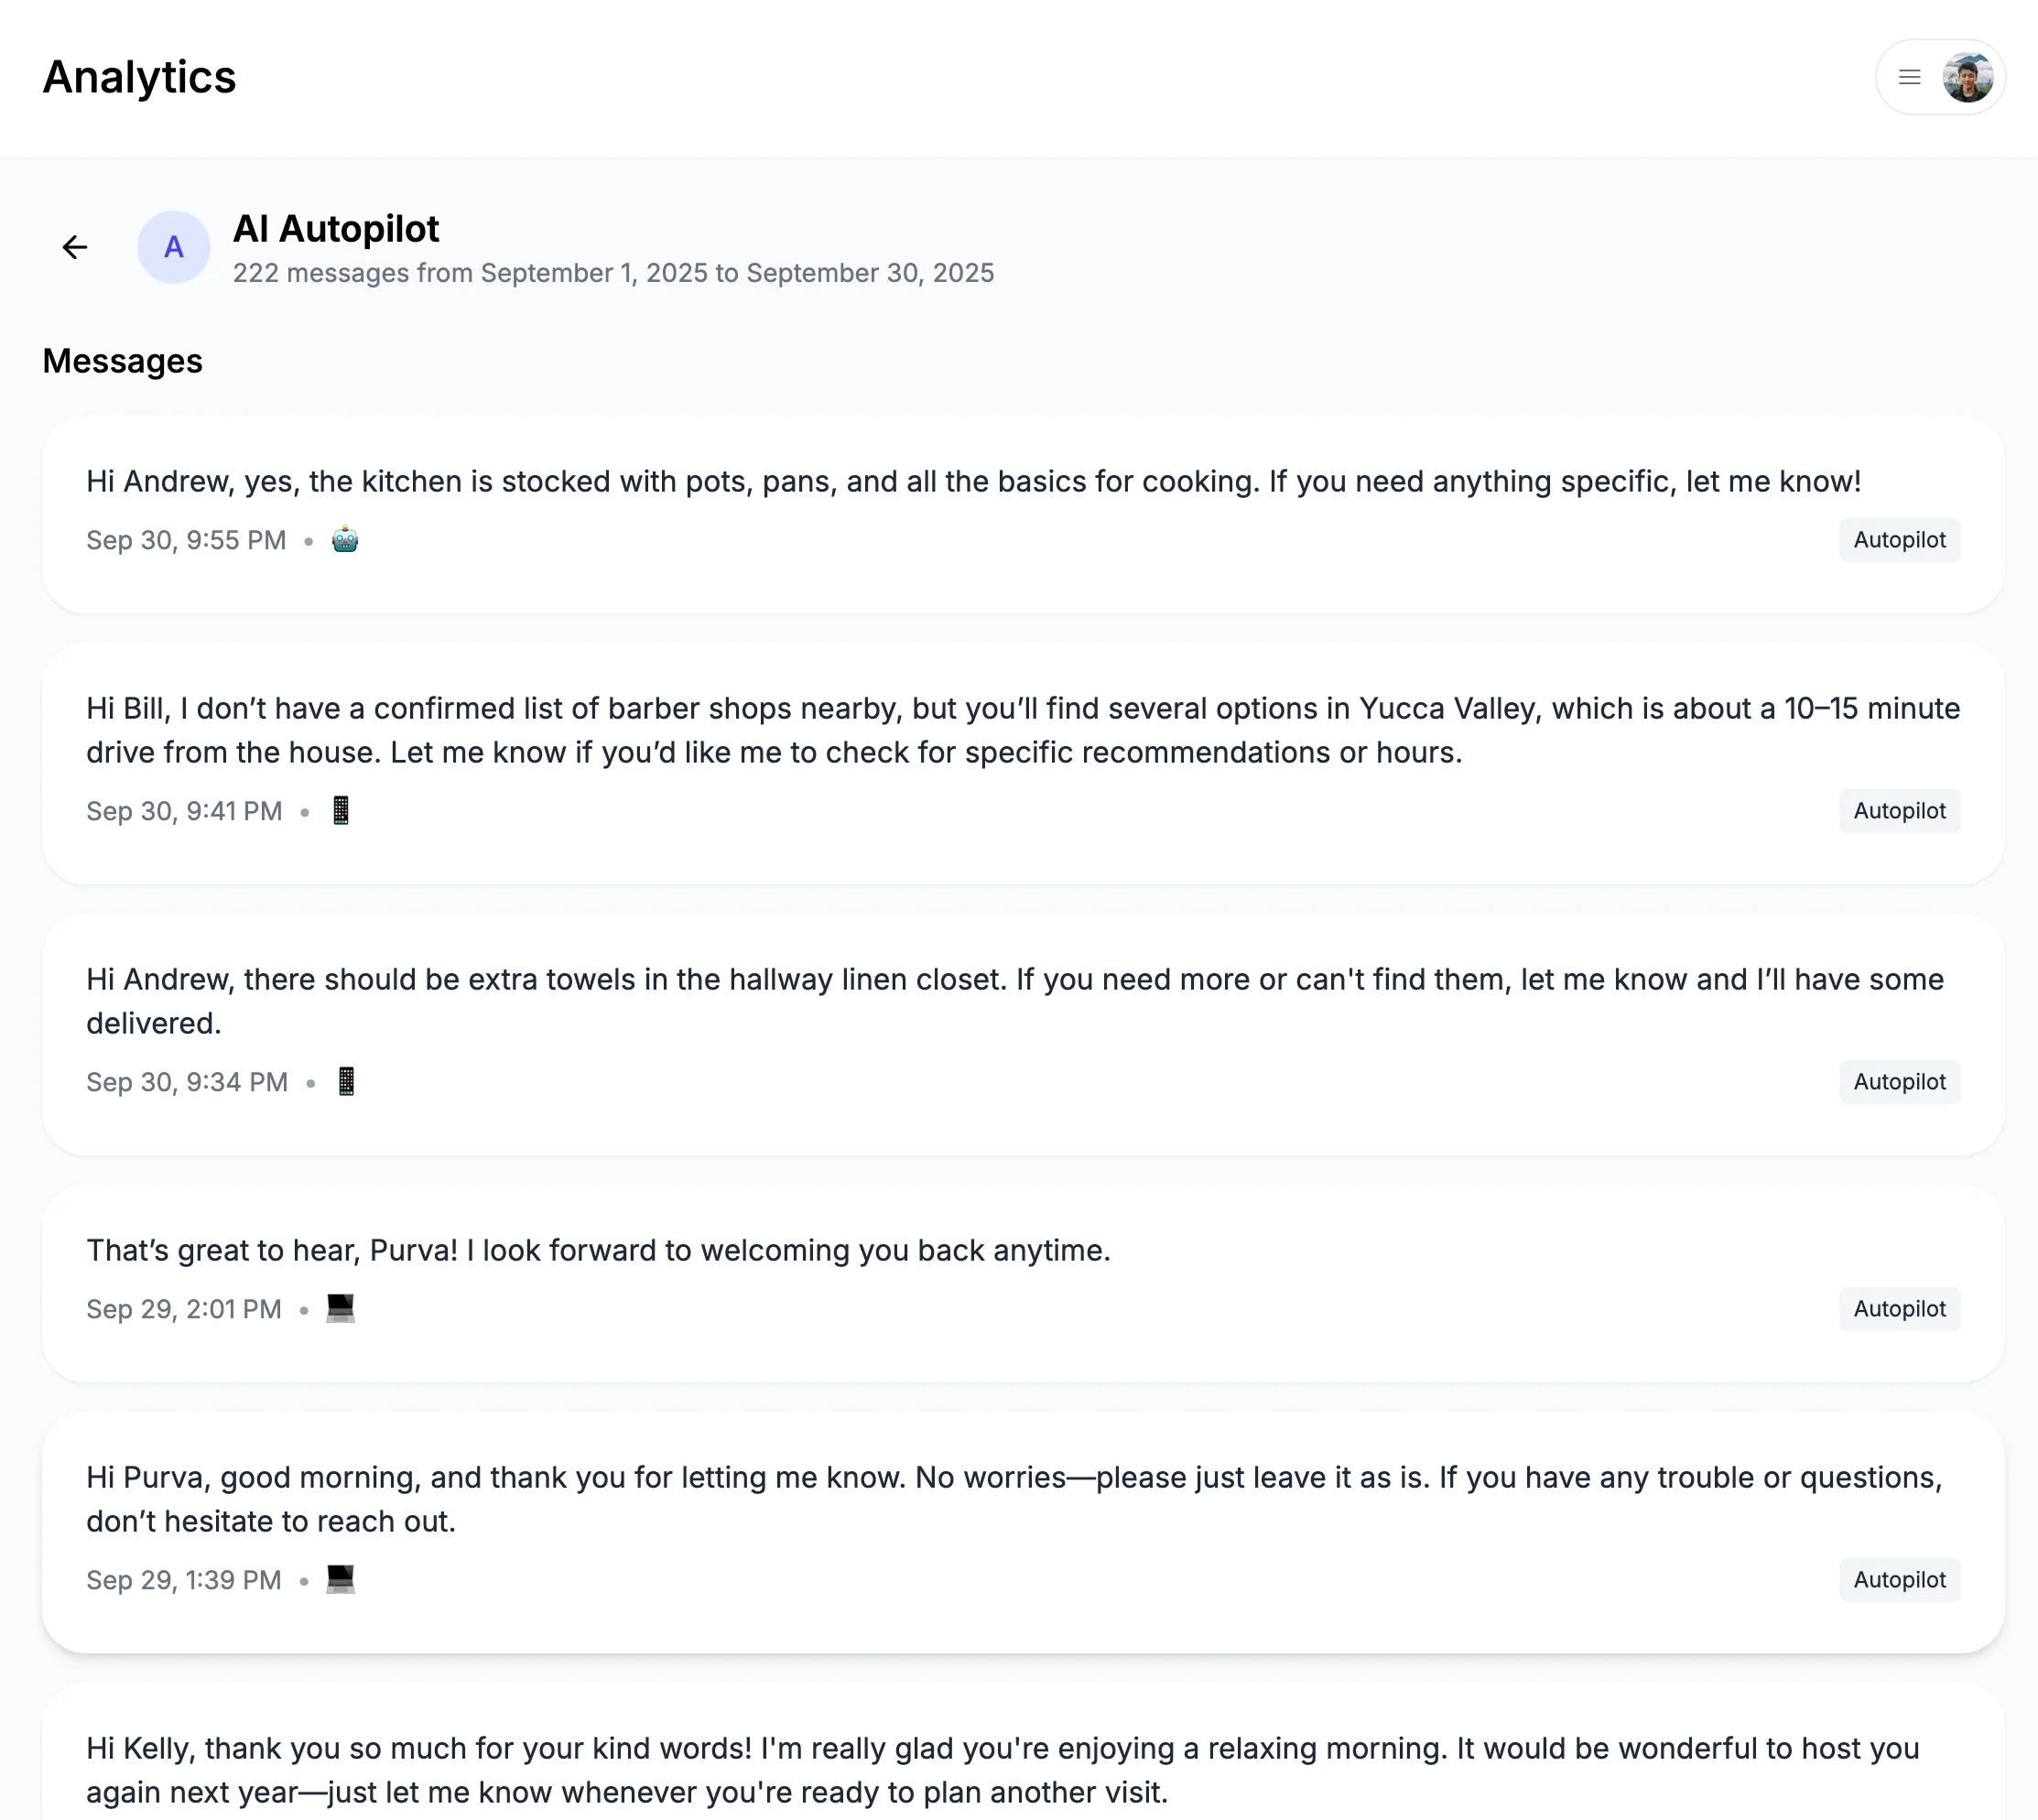
- Escalated and Autopilot lists — the low-confidence messages that were escalated for a human, and the high-confidence messages Autopilot sent on its own. Both can be filtered by category and listing.
Cleanings
Quality tracking for your cleaning team, drawn from guest cleanliness feedback:
- Ratings by assignee — average rating, total cleanings, total reviews, and five-star rate per cleaner, with the full 1–5 rating distribution.
- Per-assignee drill-down — open a cleaner to see each rated cleaning, the linked reservation and guest, the star rating, and the review text.
Ask AI
Usage analytics for the staff-facing AI assistant:
- Overview — total sessions, total messages, active users, and average messages per session.
- Per-user usage — sessions and message counts per team member, plus when they were last active.
- Session transcripts — open any session to read the full conversation between a staff member and the assistant.
Reviews
Review analytics for your listings, so you can track how guest reviews are trending alongside the rest of your operations.
What's next?
Make data-driven decisions:
- Earnings - Deep dive into revenue and payouts
- Automated Cleaning - Turn cleaning quality data into a smoother turnover workflow
- Calendar Management - Optimize your booking calendar
✅ Success: Great hosts use data to make informed decisions. Review your analytics regularly and act on insights to continuously improve!